GUI vars panel#
The second panel of the PyPLUTO GUI is the variables panel, which allows the user to select and manipulate the loaded variables.
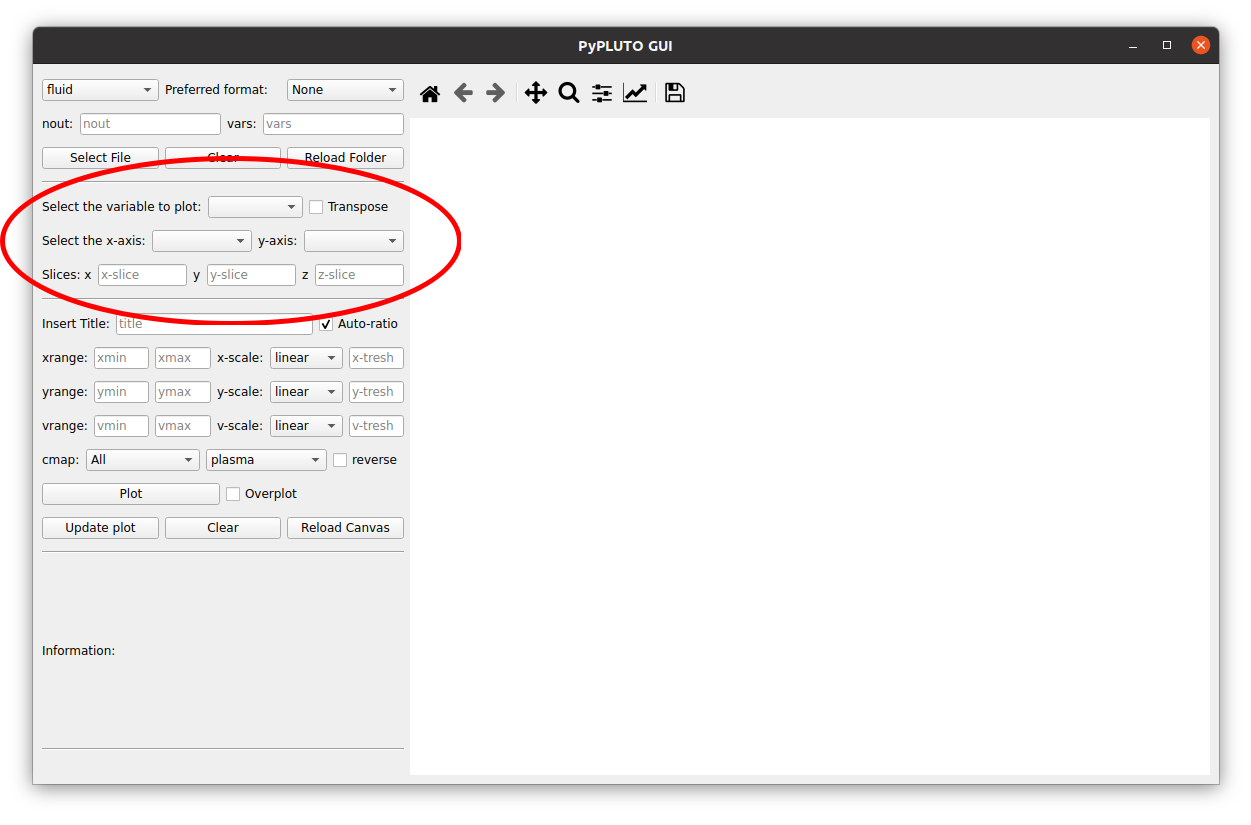
The user can select the variable to be plotted by choosing from the loaded variables.
Option: transpose#
The transpose button allows the user to transpose the selected variable. Although this is not strictly essential, it will enhance the visualization of the data, especially for 2D plots involving different codes.
Option: axes#
The x- and y-axes (in case of 2D plots) can also be selected here. The user
can choose the x- and y-axes from the loaded variables, allowing for a
flexible visualization of the data. This is particularly useful when the user
wants to plot variables from a non-cartesian geometry, such as spherical
or cylindrical coordinates.
The naming convention is the same as in the Load class, where the p or
c suffixes indicate polar or cartesian mesh transformation, respectively.
Option: slices#
In presence of 3D data, or in case the user wants to visualize a 1D slice of 2D data, the user can select the desired slice by choosing from the available slices. The slices are automatically generated based on the loaded data.
Option: custom variables#
The variable selector includes a “Custom var…” entry that opens a dialog to define new variables from mathematical expressions built from the loaded data.
Each line in the dialog follows the syntax:
NAME = EXPR
Multiple variables can be defined at once (one per line). Expressions support
standard arithmetic, NumPy-style operations (via numexpr), and the
following convenience aliases:
D.orData.prefixes are stripped automatically, soD.rhoandrhoare equivalent.Grid coordinates are available as
x1,x2,x3and, depending on geometry:Cartesian:
x,y,zPolar:
R,phi,z,x,ySpherical:
r,theta,phi,R,z
Constants
piandeare available.Inline comments are supported: anything after
#is ignored during evaluation but preserved in the session log.
A variable prefixed with ! is computed and assigned to the data object but
not added to the selector dropdown — useful for intermediate quantities:
!B2 = Bx1**2 + Bx2**2 + Bx3**2
beta = 2 * prs / B2
Protected names (base loaded variables such as rho, vx1, grid
coordinates, etc.) cannot be overridden.
Custom variables are persistent within the session: they are automatically re-evaluated whenever a new output is loaded, so time-evolution plots work without redefining expressions.