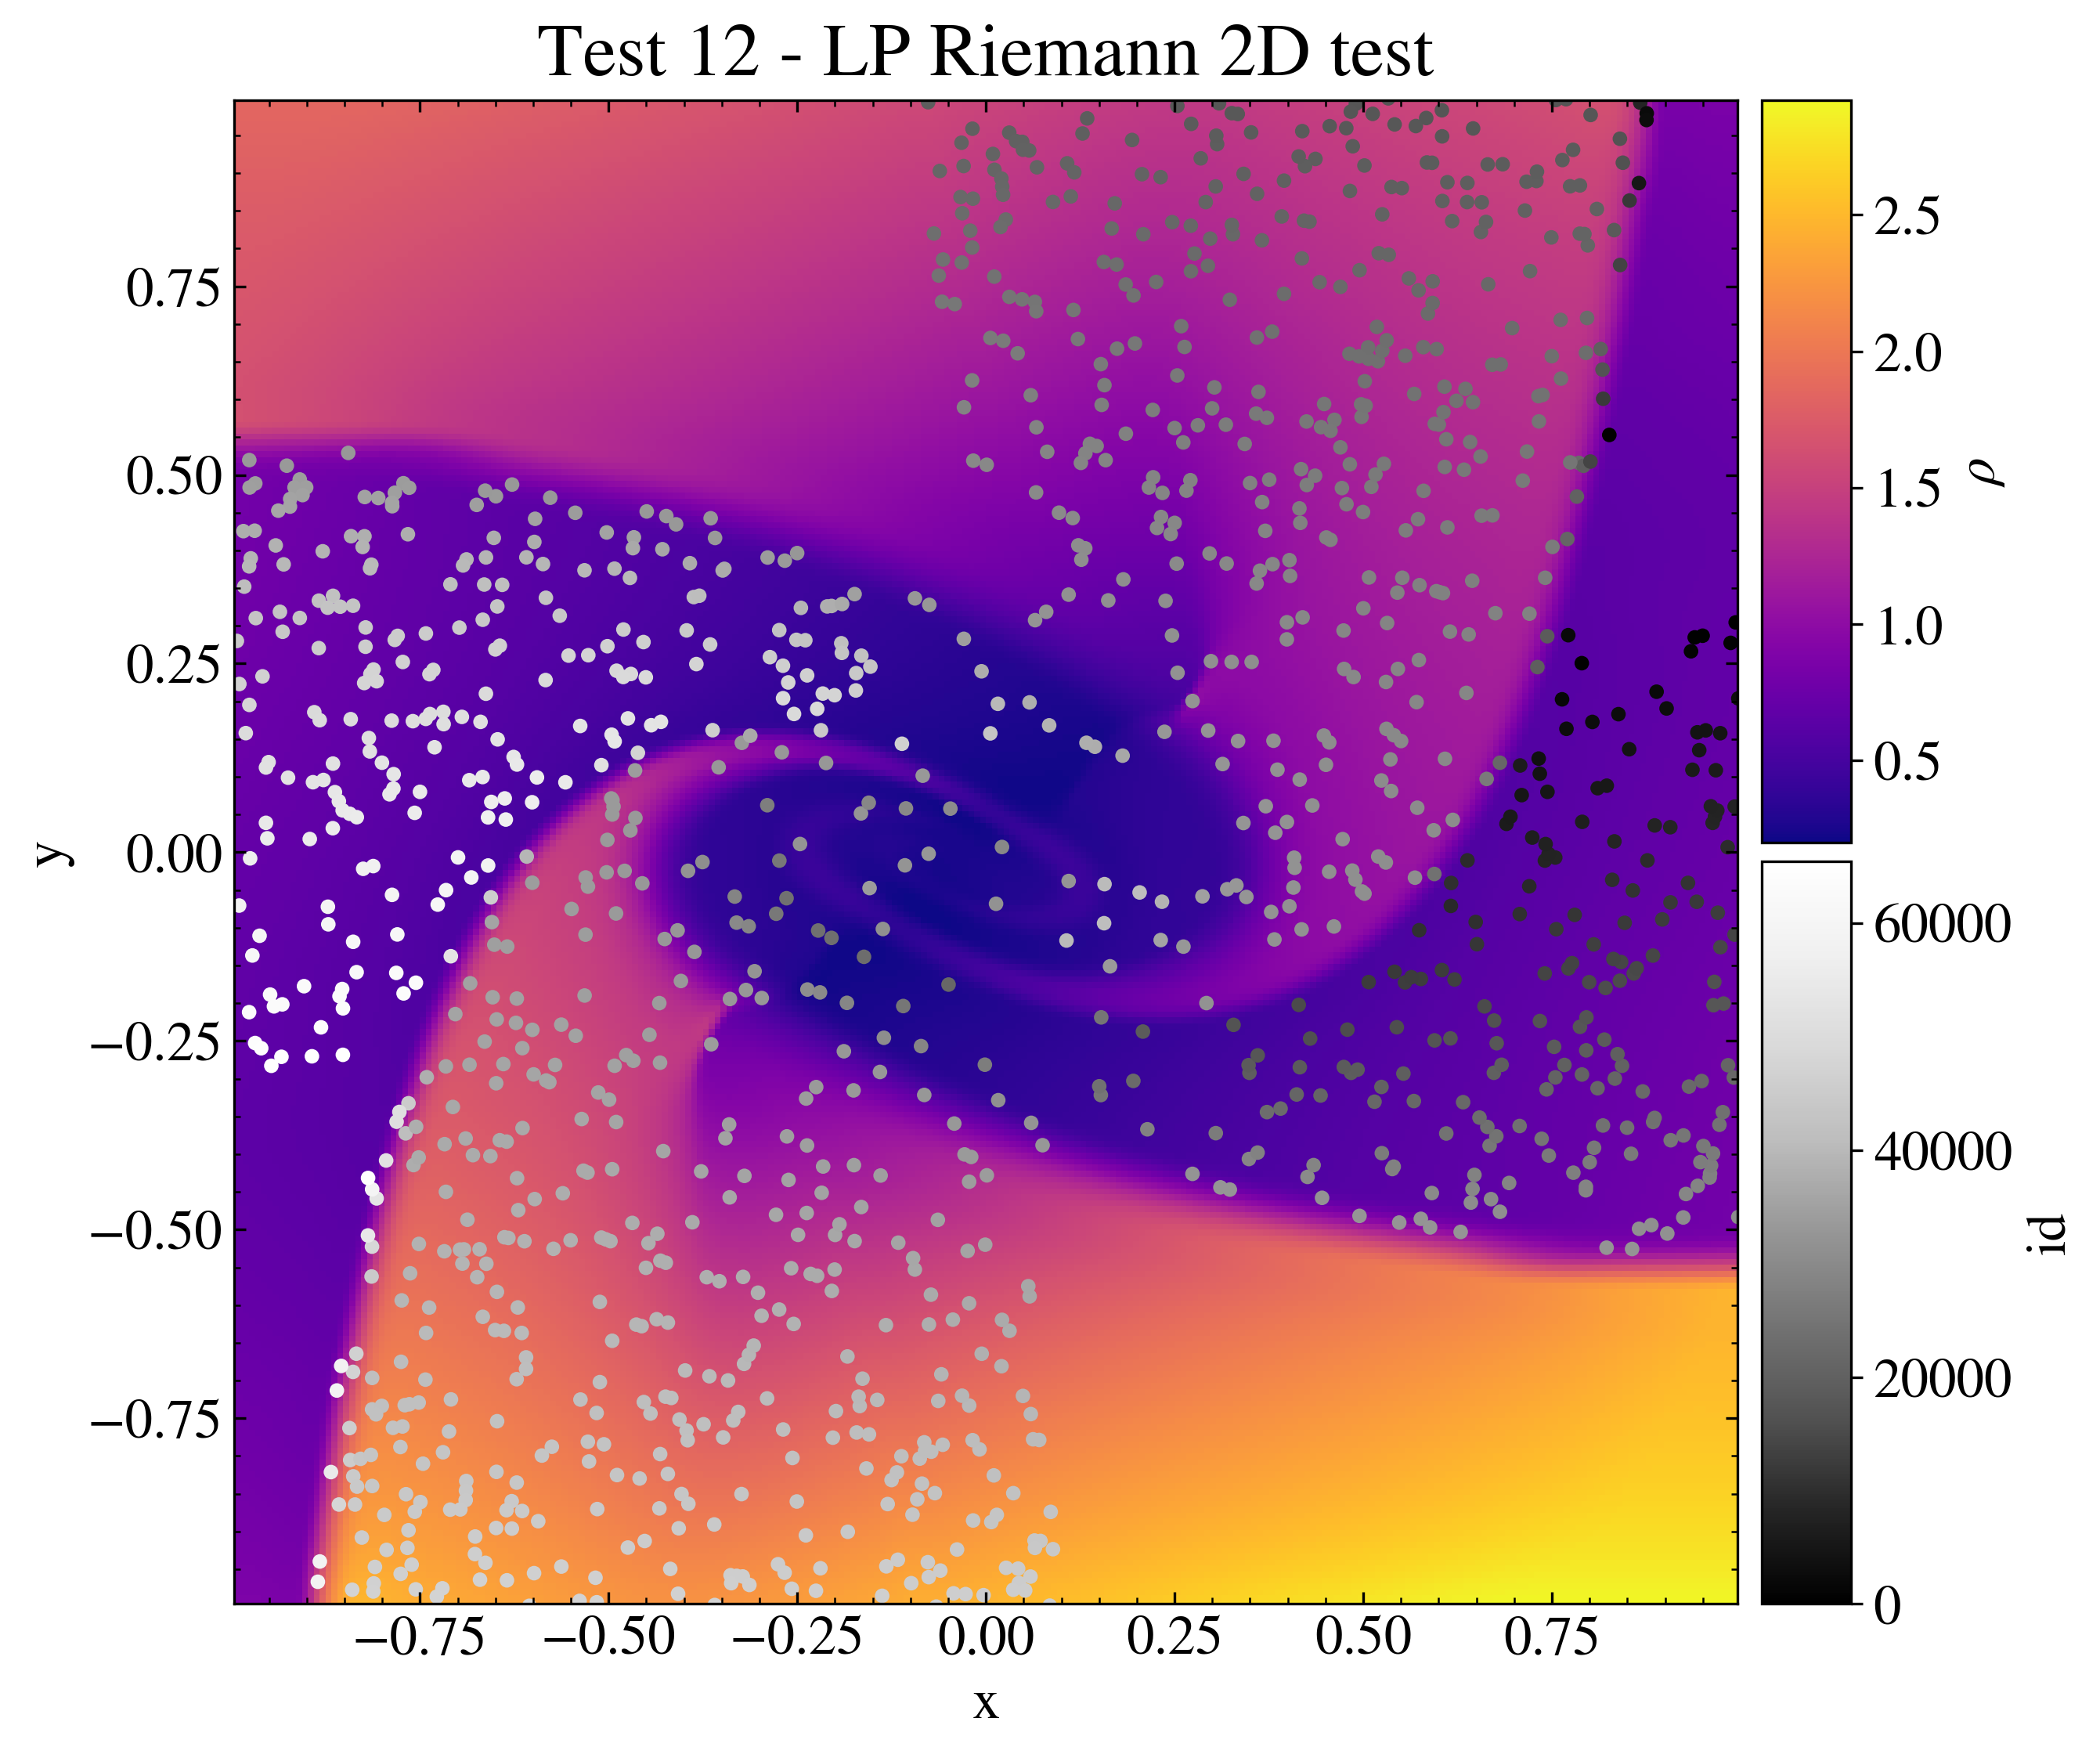
"""Particle LP Riemann 2D test.

This test shows how to plot data from the Load class and the LoadPart
class simultaneously and how to produce a scatter plot on a omplex axes
grid.

The data are the ones obtained from the PLUTO test problem
$PLUTO_DIR/Test_Problems/Particles/LP/Riemann_2D (configuration 1).

The data is loaded with the Load class and the LoadPart class into two
pload objects, and the Image class is created. The display method is
used to plot the density, and the scatter method is used to plot the
loaded particles at the final time of the simulation. Two color bars are
then created in order to show the particle identity and the fluid
velocity values. The image is then saved and shown on screen.

"""

# Loading the relevant packages
import numpy as np

import pyPLUTO

# Set the relative path to the data folder
data_path = pyPLUTO.find_example("Particles/LP/Riemann_2D")

# Loading the data and the particle data into two pload objects
Data_f = pyPLUTO.Load(path=data_path)
Data_p = pyPLUTO.LoadPart(path=data_path)

# Creating the image and the axes
Image = pyPLUTO.Image(figsize=[9.5, 8], nwin=12)
Image.create_axes(right=0.8)
Image.create_axes(nrow=2, left=0.81, right=0.85, hspace=0.01)

# Plotting the data
pcm = Image.display(
    Data_f.rho, x1=Data_f.x1, x2=Data_f.x2, ax=0, aspect="equal"
)
indx = np.argsort(Data_p.vx1**2 + Data_p.vx2**2 + Data_p.vx3**2)

# Plot the fluid colorbar
Image.colorbar(pcm, cax=1, clabel=r"$\rho$")

# Plot the particles
pcm = Image.scatter(
    Data_p.x1[indx[::20]],
    Data_p.x2[indx[::20]],
    ax=0,
    c=Data_p.id[indx[::20]],
    cmap="Greys_r",
    title="Test 12 - LP Riemann 2D test",
    titlesize=23,
    ms=20,
    vmin=0,
    xtitle="x",
    ytitle="y",
)

# Plot the particles colorbar
Image.colorbar(pcm, cax=2, clabel="id")

# Saving the image and showing the plot
Image.savefig("test12_riemannlp.png", script_relative=True)
# pyPLUTO.show()
 """Particle LP Riemann 2D test. This test shows how to plot data from the Load class and the LoadPart class simultaneously and how to produce a scatter plot on a omplex axes grid. The data are the ones obtained from the PLUTO test problem $PLUTO_DIR/Test_Problems/Particles/LP/Riemann_2D (configuration 1). The data is loaded with the Load class and the LoadPart class into two pload objects, and the Image class is created. The display method is used to plot the density, and the scatter method is used to plot the loaded particles at the final time of the simulation. Two color bars are then created in order to show the particle identity and the fluid velocity values. The image is then saved and shown on screen. """ # Loading the relevant packages import numpy as np import pyPLUTO # Set the relative path to the data folder data_path = pyPLUTO.find_example("Particles/LP/Riemann_2D") # Loading the data and the particle data into two pload objects Data_f = pyPLUTO.Load(path=data_path) Data_p = pyPLUTO.LoadPart(path=data_path) # Creating the image and the axes Image = pyPLUTO.Image(figsize=[9.5, 8], nwin=12) Image.create_axes(right=0.8) Image.create_axes(nrow=2, left=0.81, right=0.85, hspace=0.01) # Plotting the data pcm = Image.display( Data_f.rho, x1=Data_f.x1, x2=Data_f.x2, ax=0, aspect="equal" ) indx = np.argsort(Data_p.vx1**2 + Data_p.vx2**2 + Data_p.vx3**2) # Plot the fluid colorbar Image.colorbar(pcm, cax=1, clabel=r"$\rho$") # Plot the particles pcm = Image.scatter( Data_p.x1[indx[::20]], Data_p.x2[indx[::20]], ax=0, c=Data_p.id[indx[::20]], cmap="Greys_r", title="Test 12 - LP Riemann 2D test", titlesize=23, ms=20, vmin=0, xtitle="x", ytitle="y", ) # Plot the particles colorbar Image.colorbar(pcm, cax=2, clabel="id") # Saving the image and showing the plot Image.savefig("test12_riemannlp.png", script_relative=True) # pyPLUTO.show()